You sent a survey. People answered. Now you’re staring at a number wondering what it actually means — and whether you measured the right thing in the first place.
Here’s the good news: you only need three metrics to cover almost every feedback question you’ll ever ask. NPS, CES, and CSAT. Each one answers a different question, and once you know which is which, you’ll never send a vague “How are we doing?” survey again.
By the end of this post, you’ll know exactly which metric to use, when to use it, and what to ask. Let’s get into it.
The 30-Second Summary
If you’re short on time, here’s the whole post in one table:
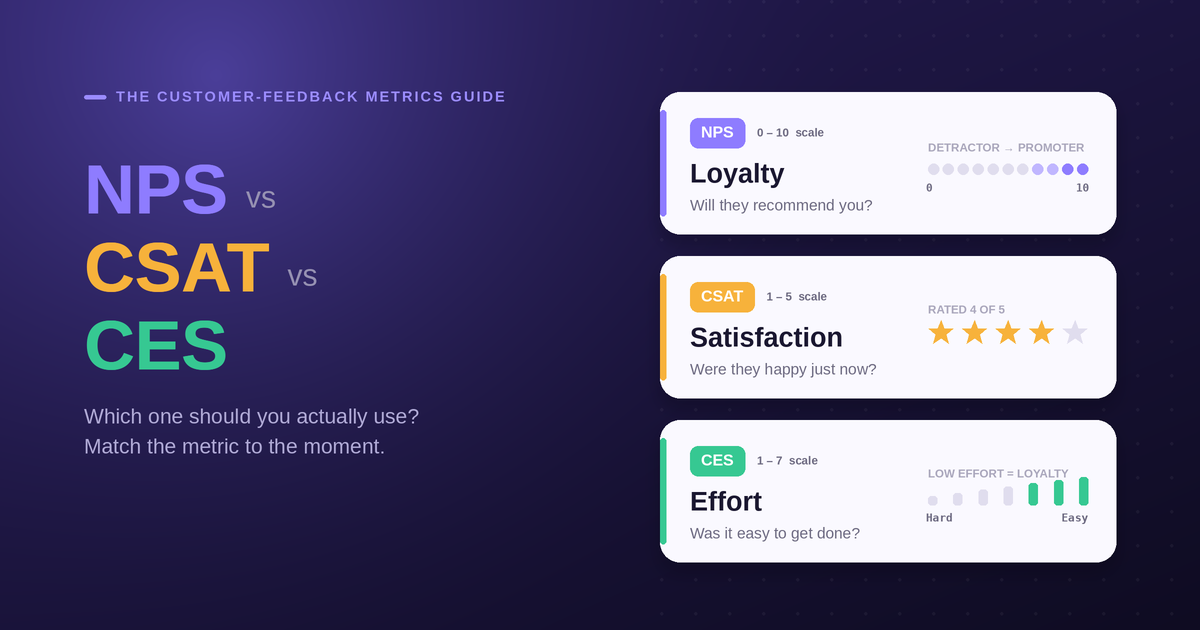
| Metric | Measures | Classic question | Scale | Best for |
| NPS | Loyalty & advocacy | “How likely are you to recommend us?” | 0–10 | Relationship health, long-term trends |
| CSAT | Satisfaction | “How satisfied were you with X?” | 1–5 | A specific interaction or touchpoint |
| CES | Effort / friction | “How easy was it to do X?” | 1–7 | Support, checkout, onboarding |
The one-line rule: NPS tells you if people love you. CSAT tells you if they’re happy right now. CES tells you if you’re making things hard.
Now let’s break each one down with real examples.
What Is NPS (Net Promoter Score)?
NPS measures loyalty. It answers one big question: will people stick around and tell their friends about you?
You ask:
“How likely are you to recommend [company] to a friend or colleague?”
People answer on a 0–10 scale. Then you sort them into three buckets:
- Promoters (9–10): Your fans. They renew, refer, and rave.
- Passives (7–8): Content but not loyal. One bad day and they’re gone.
- Detractors (0–6): Unhappy. They churn — and sometimes warn others.
The math is simple:
NPS = % Promoters − % Detractors
Say 100 people respond: 50 promoters, 30 passives, 20 detractors. Your NPS is 50 − 20 = +30. (Passives are ignored in the math, but their comments still matter.)
Scores run from −100 to +100. Anything above 0 means you have more fans than critics. Above +50 is excellent.
Use NPS when you want to:
- Track relationship health over months and quarters
- Benchmark against competitors or industry averages
- Spot churn risk before it happens
Pro tip: The score is the boring part. The follow-up question is where the gold is. Always add: “What’s the main reason for your score?” That open text is what tells you why — and AI analysis can cluster those answers into themes in seconds.
What Is CSAT (Customer Satisfaction Score)?
CSAT is the most intuitive of the three. It measures how satisfied someone is with a specific thing that just happened.
You ask:
“How satisfied were you with [your support experience / your order / this feature]?”
People answer on a 1–5 scale (sometimes stars, sometimes emoji). Then:
CSAT = (Satisfied responses ÷ Total responses) × 100
“Satisfied” usually means the top two options (4 and 5). If 80 out of 100 people picked 4 or 5, your CSAT is 80%.
Use CSAT right after a moment that matters:
- After a support ticket closes
- After a purchase or delivery
- After someone tries a new feature
- After an event or onboarding call
CSAT is fast, easy to understand, and great for catching problems in the moment. The trade-off: it’s a snapshot. A high CSAT on one interaction doesn’t mean someone is loyal — that’s NPS’s job.
Sample CSAT questions:
- “How satisfied were you with the help you received today?”
- “How would you rate your delivery experience?”
- “Did this article solve your problem?” (yes/no is a valid CSAT-style signal too)
What Is CES (Customer Effort Score)?
CES measures friction. The insight behind it: people don’t just want to be delighted — they want things to be easy. Low effort predicts loyalty surprisingly well.
You ask:
“How easy was it to [resolve your issue / complete checkout / set up your account]?”
People answer on a 1–7 scale, from “Very difficult” to “Very easy.” A common phrasing is an agree/disagree statement: “The company made it easy to handle my issue.”
Use CES at high-friction moments:
- After a support chat or ticket
- After checkout or signup
- During onboarding (where drop-off is brutal)
- After a returns or cancellation flow
If your CES is low, you’ve found exactly where users are struggling — and effort problems are usually fixable. Confusing form? Hidden button? Too many steps? CES points right at it.
Sample CES questions:
- “How easy was it to get your problem solved?”
- “How much effort did you have to put in to complete your purchase?”
- “Setting up my account was simple.” (Strongly disagree → Strongly agree)
NPS vs CES vs CSAT: How to Choose
Still not sure which to send? Match the metric to the moment.
- You want the big picture of loyalty over time → NPS
- You want to know if one interaction landed well → CSAT
- You want to find and kill friction → CES
A smart feedback program often uses all three:
- CSAT + CES fire automatically after key moments (a closed ticket, a completed order).
- NPS goes out on a steady cadence — quarterly is common — to track the overall relationship.
Think of it like a health check. CSAT and CES are your daily vitals. NPS is your annual physical.
How Forms and Surveys Make This Actually Work
Knowing the difference between NPS, CSAT, and CES is step one. Collecting clean, high-completion responses is where most teams stumble.
The classic problems:
- Surveys feel like homework. Long, ugly forms get abandoned. A 5% completion rate gives you noisy data.
- You’re stuck reading hundreds of open-text replies by hand. The score is easy; the why is buried.
- The data lives in a spreadsheet and never reaches the people who can act on it.
Good forms and surveys fix all three. The key moves:
- Ask one question at a time. Conversational, one-question-per-screen surveys consistently beat dense forms on completion. People answer when it feels like a chat, not a tax form.
- Trigger surveys at the right moment. Send CSAT the instant a ticket closes, not three days later when the memory’s gone.
- Let AI do the reading. Instead of manually tagging 400 open-text NPS comments, AI-powered analysis groups them into themes and sentiment automatically — so “checkout is confusing” surfaces in seconds, not hours.
This is exactly where Feedal helps. You can describe the survey you want in plain English and let AI generate it, share a beautiful conversational form that people actually finish, and get an instant AI summary of themes and sentiment across your NPS, CSAT, and CES responses. White-label it so it matches your brand, plug it into your stack, and the insight comes to you — no spreadsheet archaeology required.
The point isn’t the tool. The point is that the right metric plus a form people finish plus analysis you don’t have to do by hand is what turns feedback into decisions.
Quick-Start Templates
Steal these and ship today.
NPS survey
- “How likely are you to recommend [company] to a friend or colleague?” (0–10)
- “What’s the main reason for your score?” (open text)
CSAT survey (post-support)
- “How satisfied were you with the support you received?” (1–5)
- “Anything we could’ve done better?” (open text)
CES survey (post-checkout)
- “How easy was it to complete your purchase?” (Very difficult → Very easy)
- “What made it easy or hard?” (open text)
Notice the pattern: one rating question, one open question. That second question is where your best insights live.
The Takeaway
You don’t have to choose just one. You have to choose the right one for the moment:
- NPS for loyalty and the long view.
- CSAT for satisfaction in the moment.
- CES for friction you can fix.
Pick the metric, keep the survey short and conversational, and let AI handle the heavy reading. That’s the whole game.
Ready to build a survey people actually finish? Try Feedal for free and turn your next round of feedback into clear, AI-summarized insight.
FAQ
Is NPS better than CSAT or CES? No single metric is “better” — they answer different questions. NPS measures long-term loyalty, CSAT measures satisfaction with a specific moment, and CES measures effort. Most strong feedback programs use all three.
What is a good NPS score? Any score above 0 means you have more promoters than detractors. Above +30 is generally good, and above +50 is excellent. Benchmarks vary widely by industry, so compare against your own trend over time as well as competitors.
How often should I send an NPS survey? Quarterly is a common cadence for relationship NPS. Send CSAT and CES surveys event-based — right after the relevant interaction — rather than on a fixed schedule.
Can I run NPS, CSAT, and CES in one tool? Yes. With a platform like Feedal you can build all three as conversational forms, trigger them at the right moments, and analyze the open-text responses with AI in one place.
Why are my survey completion rates so low? Usually it’s length and format. Long, multi-question-per-page forms feel like work. Switching to a one-question-at-a-time conversational survey typically lifts completion significantly.