Choosing the right rating scale can make or break your feedback strategy. While the 1 to 5 rating scale dominates customer surveys and employee evaluations, it’s not the only option available. Understanding when and why to use a 1 to 5 rating scale—versus alternatives like 1 to 10 scales, yes/no questions, or star ratings—directly impacts response quality and business outcomes.
This guide examines the 1 to 5 rating scale against competing measurement systems, helping you select the optimal approach for your specific feedback needs.
Why Rating Scales Matter More Than You Think
Before diving into comparisons, consider this: the scale you choose fundamentally shapes the data you receive. A poorly chosen rating system leads to:
- Low response rates due to survey fatigue
- Ambiguous data that’s difficult to interpret
- Response bias that skews results
- Inability to track meaningful changes over time
- Wasted opportunities to understand your customers
The 1 to 5 rating scale has become an industry standard, but is it always the right choice for your situation?

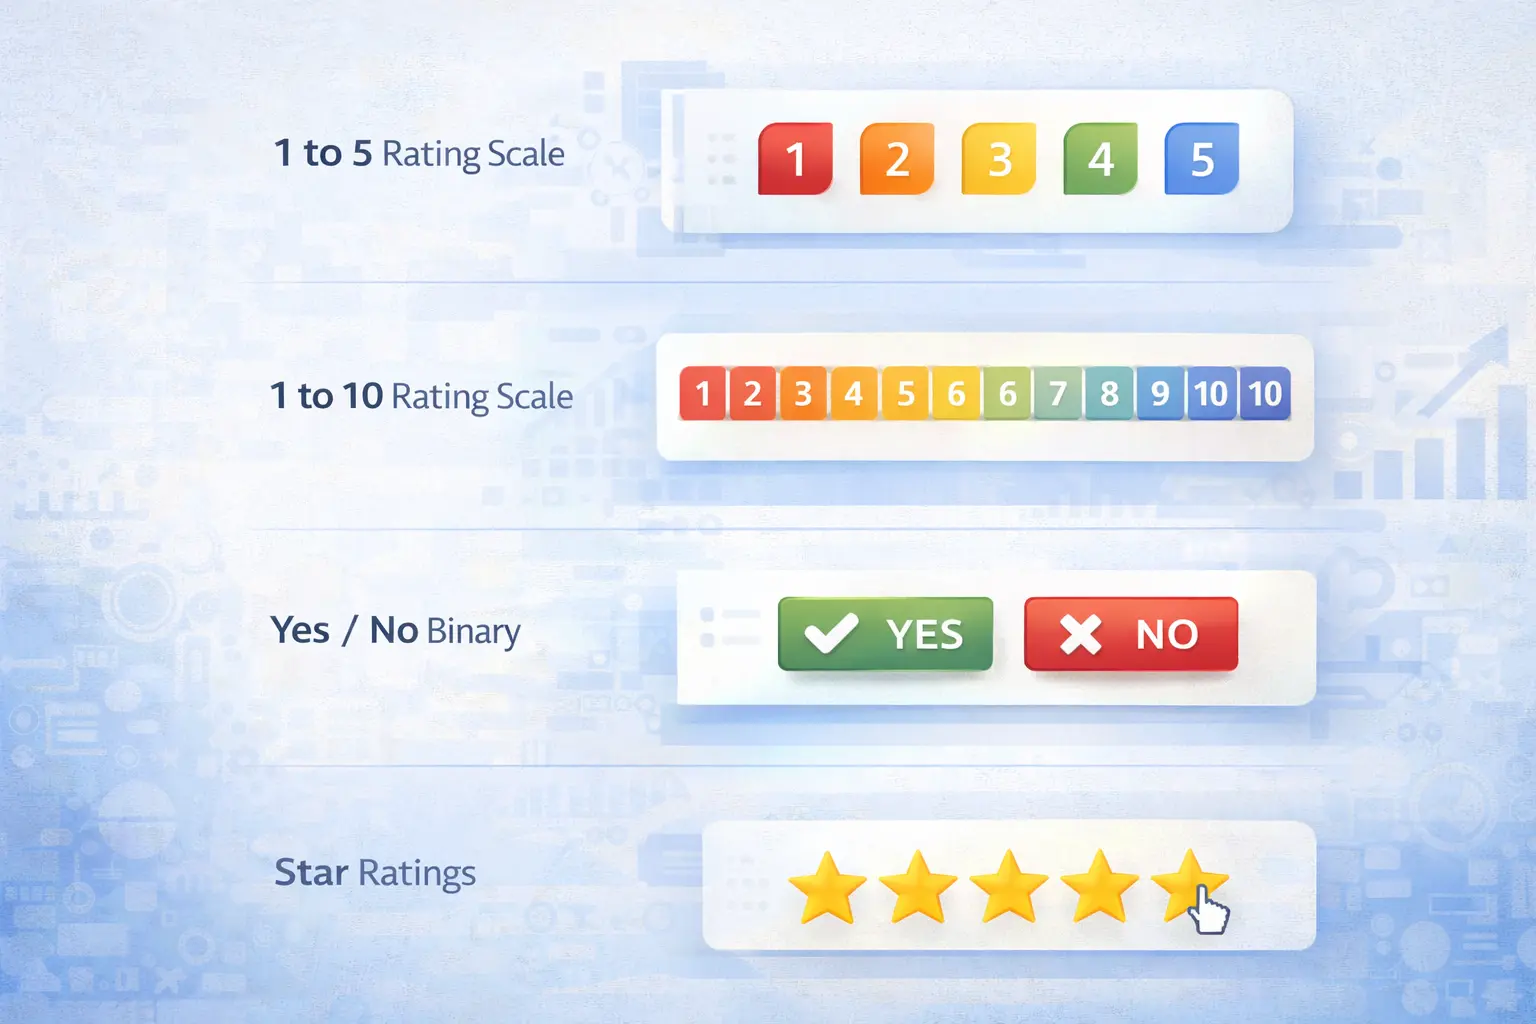
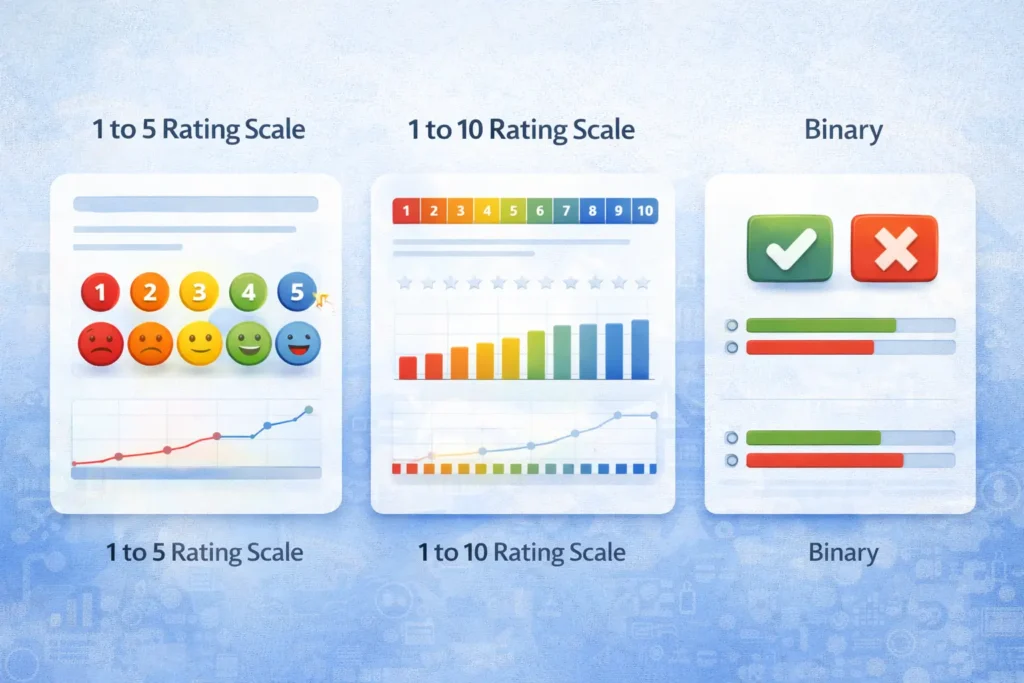
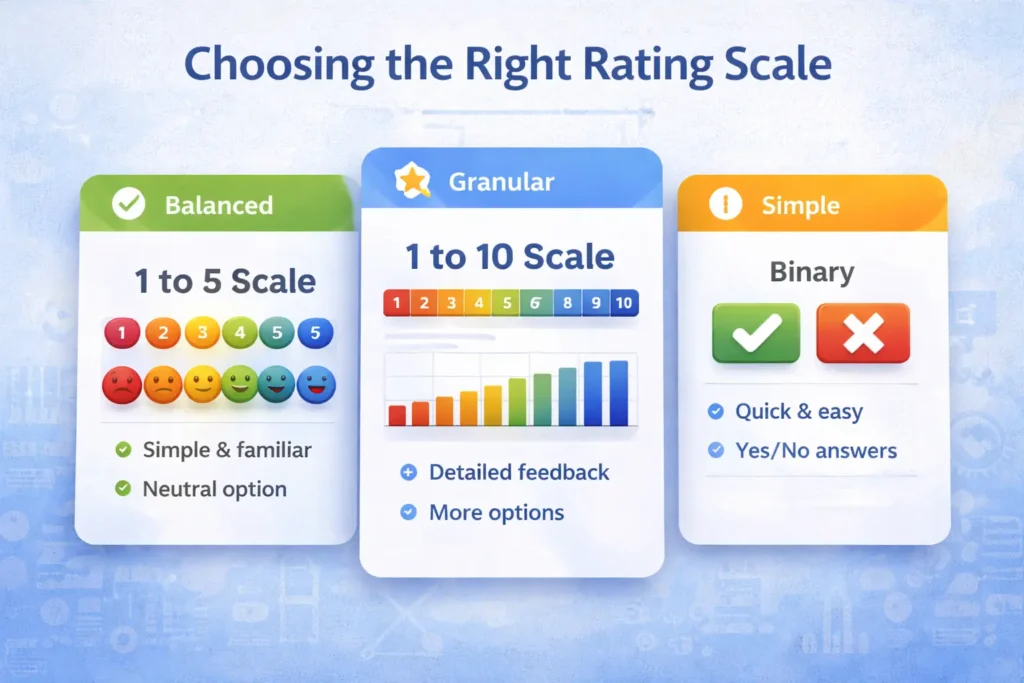
1 to 5 Rating Scale: The Balanced Choice
The classic 1 to 5 rating scale offers five distinct response options, typically ranging from “Very Dissatisfied” to “Very Satisfied” or “Strongly Disagree” to “Strongly Agree.”
Strengths of the 1 to 5 Rating Scale
Cognitive Ease: Respondents process five options quickly without mental strain. Research in cognitive psychology shows that humans naturally categorize experiences into roughly five levels of intensity.
High Completion Rates: The 1 to 5 rating scale strikes an optimal balance—enough nuance to capture meaningful differences without overwhelming respondents. Surveys using this format typically see 15-25% higher completion rates than those with more complex scales.
Universal Recognition: Most people have encountered the 1 to 5 rating scale countless times—from restaurant reviews to product ratings. This familiarity eliminates learning curves and reduces errors.
Statistical Flexibility: Data from a 1 to 5 rating scale can be analyzed using various statistical methods, from simple averages to sophisticated regression models.
Neutral Option Available: The middle point (3) allows respondents to express genuine neutrality or indifference, which is often valuable information.
Limitations of the 1 to 5 Rating Scale
Central Tendency Bias: Some respondents gravitate toward the middle option (3) when uncertain, which can dilute insights.
Limited Granularity: For measuring subtle differences—like comparing two high-quality products—five points may not capture fine distinctions.
Cultural Variations: Different cultures interpret scales differently. Some avoid extreme ratings while others use them liberally.
The 1 to 10 Rating Scale: More Granular, But Better?
The 1 to 10 rating scale offers double the options of the 1 to 5 rating scale, theoretically providing more precise measurements.
When 1 to 10 Outperforms 1 to 5
Subtle Discrimination: When measuring slight variations in high-performing products or services, a 10-point scale can differentiate between “good” and “very good” more precisely than a 1 to 5 rating scale.
Avoiding Ceiling Effects: In contexts where most responses cluster at the top of a 1 to 5 rating scale (everyone rates 4 or 5), expanding to 10 points spreads responses and reveals meaningful differences.
Net Promoter Score Compatibility: NPS specifically uses a 0-10 scale, so if you’re calculating this metric, consistency matters.
Why 1 to 5 Often Wins
Decision Paralysis: Ten options create cognitive overload. Respondents spend more time per question, increasing drop-off rates. Studies show surveys with 1 to 10 scales experience up to 40% lower completion rates than equivalent 1 to 5 rating scale surveys.
Artificial Precision: Do respondents truly distinguish between a 7 and an 8 on a 10-point scale? Often they’re making arbitrary choices rather than expressing genuine differences in opinion.
Harder to Interpret: What does a rating of 6 mean? It’s neither clearly positive nor negative. The 1 to 5 rating scale offers clearer interpretative zones.
Verdict: For most general-purpose feedback, the 1 to 5 rating scale delivers better response rates and more reliable data. Reserve 10-point scales for specialized contexts requiring fine-grained discrimination.
Binary Scales: The Simplicity Trade-Off
Binary scales offer just two options: Yes/No, Agree/Disagree, Good/Bad, or thumbs up/thumbs down.
Binary Scale Advantages
Maximum Simplicity: Nothing is easier than clicking a single button. Binary feedback can be collected in seconds.
High Volume Collection: When you need feedback from thousands of respondents quickly, binary scales maximize participation.
Clear Action Signals: A “No” or thumbs down provides an unambiguous signal that something is wrong.
Why 1 to 5 Rating Scales Provide More Value
Loss of Nuance: Binary scales can’t distinguish between “somewhat satisfied” and “extremely satisfied.” This loss of granularity makes it impossible to track improvements in the middle range.
No Context for Extremes: A “No” rating doesn’t tell you whether the experience was slightly disappointing or completely unacceptable. The 1 to 5 rating scale captures these important gradations.
Limited Trend Detection: When you’re trying to measure improvement over time, binary data provides less sensitivity. A shift from an average of 3.2 to 3.8 on a 1 to 5 rating scale represents meaningful progress, but binary data might still show the same proportion of positive responses.
Verdict: Use binary scales for quick pulse checks or high-volume contexts like email feedback links. For any situation requiring detailed insights, the 1 to 5 rating scale is superior.
Star Ratings: The Visual 1 to 5 Rating Scale
Star ratings (☆☆☆☆☆) are essentially a visual representation of the 1 to 5 rating scale. They’re ubiquitous in e-commerce, restaurant reviews, and entertainment.
Visual Appeal and Recognition
Stars leverage the familiarity and effectiveness of the 1 to 5 rating scale while adding visual appeal. The iconography is universally recognized—even across language barriers.
Subtle Psychological Differences
Positive Framing: Stars feel inherently positive. Five stars represents perfection, which may unconsciously encourage more generous ratings than a numerical 1 to 5 rating scale.
Mobile-Friendly: Large, tappable stars work beautifully on mobile devices, where precise clicking on numbered buttons can be frustrating.
E-commerce Expectations: In retail contexts, consumers expect star ratings. Using a different format may confuse or alienate respondents.
Verdict: Star ratings and numerical 1 to 5 rating scales are functionally equivalent. Choose stars for consumer-facing contexts and when visual appeal matters. Use numerical scales for professional or B2B contexts.
The 1 to 7 Rating Scale: The Middle Ground
Some researchers advocate for 7-point scales as a compromise between the 1 to 5 rating scale’s simplicity and the 1 to 10 scale’s granularity.
The Case for Seven Points
More Variation Without Overload: Seven options provide additional nuance while remaining cognitively manageable. Some research suggests 7-point scales maximize reliability.
Stronger Middle Ground: With three neutral or middle options (3, 4, 5), respondents can express varying degrees of ambivalence.
Why 1 to 5 Remains More Popular
Diminishing Returns: The additional two points rarely provide proportional value. Most respondents can’t reliably distinguish seven levels of satisfaction.
Slower Responses: Every additional option increases decision time. The difference between 5 and 7 points seems small, but it compounds across multiple questions.
Less Standardized: The 1 to 5 rating scale benefits from universal recognition. Respondents encountering a 7-point scale may need to read all options carefully, slowing them down.
Verdict: Unless you’re conducting academic research requiring maximum statistical sensitivity, the 1 to 5 rating scale offers superior practical performance.
Semantic Differential Scales: Opposite Anchors
Semantic differential scales present opposing concepts at each end (e.g., “Modern ←→ Traditional” or “Expensive ←→ Affordable”) with a 1 to 5 or 1 to 7 scale between them.
Unique Strengths
Captures Perceptions: Excellent for brand positioning and perceptual mapping. You can understand where your product sits on multiple dimensions simultaneously.
Reduces Acquiescence Bias: Unlike standard 1 to 5 rating scales where respondents might automatically agree with statements, semantic scales force more thoughtful consideration.
Integration with Standard Scales
You can combine semantic differential approaches with a 1 to 5 rating scale structure, getting the best of both worlds. For example, “How would you rate our service?” with opposing anchors “Impersonal (1) ←→ Personalized (5).”
Verdict: Use semantic differentials for specific branding or positioning questions, but rely on traditional 1 to 5 rating scales for general satisfaction and performance measurement.
Even vs. Odd Number of Options
Should your 1 to 5 rating scale include a neutral middle option, or should you force respondents to lean positive or negative with an even-numbered scale (1 to 4 or 1 to 6)?
The Case for the Middle Option (1 to 5)
Reflects Reality: Not every experience is clearly positive or negative. Sometimes people genuinely feel neutral or haven’t formed an opinion. The 1 to 5 rating scale respects this reality.
Reduces Frustration: Forcing a choice when respondents feel neutral creates resentment and arbitrary responses that corrupt your data.
More Honest Responses: When given a middle option, respondents who feel strongly still choose extreme options. You don’t lose the signal from passionate respondents.
The Forced-Choice Argument
Eliminates Fence-Sitting: Some respondents use the middle option as an easy out rather than thinking deeply. Removing it forces a directional opinion.
Clearer Action Signals: With no neutral option, you immediately know whether sentiment leans positive or negative.
Research Verdict
Studies consistently show that including a neutral middle option (as in the standard 1 to 5 rating scale) produces more reliable and valid data. Force-choice scales are best reserved for specific contexts where you truly need directional feedback—like voting or preference decisions.
Implementing the Right Scale: Practical Considerations
Match Scale to Question Type
Satisfaction Questions: The classic 1 to 5 rating scale excels here. “How satisfied are you with [X]?” with responses from Very Dissatisfied to Very Satisfied.
Frequency Questions: Use labeled frequency scales: Never, Rarely, Sometimes, Often, Always. This is a specialized 1 to 5 rating scale optimized for behavioral questions.
Agreement Questions: Likert scales (Strongly Disagree to Strongly Agree) work best for opinion statements. This is another variation of the 1 to 5 rating scale.
Quality Assessments: For evaluating quality, use Poor to Excellent anchors on your 1 to 5 rating scale.
Consider Your Audience
General Consumers: Stick with the 1 to 5 rating scale or star ratings. These formats are instantly recognizable and require zero explanation.
Industry Professionals: B2B audiences can handle slightly more complex scales if necessary, but the 1 to 5 rating scale still performs well.
International Audiences: Cultural differences affect scale interpretation. The widely-recognized 1 to 5 rating scale minimizes cross-cultural confusion.
Technology and Platform Considerations
Modern feedback platforms make it easy to implement any scale type, but consider the user experience. Mobile respondents, in particular, benefit from the simplicity of a 1 to 5 rating scale with large, tappable buttons.
Tools like Feedal.io optimize the 1 to 5 rating scale experience across devices, ensuring your surveys look professional and function smoothly whether respondents are on desktop, tablet, or smartphone. The platform automatically handles best practices like randomization, mobile optimization, and accessibility features that maximize response quality.
The Data Analysis Advantage
Beyond collection, consider how you’ll analyze results. The 1 to 5 rating scale offers significant analytical advantages:
Simple Averaging: Calculate mean scores instantly. A 4.2 average clearly indicates strong performance.
Trend Tracking: Plot average scores over time to visualize improvements or declines.
Segmentation: Compare 1 to 5 rating scale averages across customer types, products, or regions.
Statistical Testing: Determine if score differences are statistically significant using t-tests or ANOVA.
Benchmarking: Industry benchmarks typically use 1 to 5 rating scales, enabling easy comparison.
More complex scales often require more sophisticated analysis, slowing down your ability to act on insights.
Common Mistakes in Scale Selection
Mixing Scales in One Survey: Using a 1 to 5 rating scale for some questions and a 1 to 10 scale for others confuses respondents and complicates analysis. Maintain consistency.
Too Many Scale Points for Complex Topics: When asking about complicated or technical subjects, adding more scale points doesn’t improve accuracy—it just frustrates respondents who aren’t sure how to rate. The 1 to 5 rating scale keeps it manageable.
Assuming More Options = Better Data: The 1 to 5 rating scale often outperforms longer scales because respondents engage more thoughtfully with fewer options.
Ignoring Mobile Experience: A scale that looks clean on desktop might be cramped and unusable on mobile. The 1 to 5 rating scale translates beautifully to small screens.
Making Your Choice: Decision Framework
Ask yourself these questions:
- What’s my primary goal? (Understanding satisfaction, measuring performance, or making quick binary decisions?)
- Who’s my audience? (General consumers favor the 1 to 5 rating scale; specialized contexts might justify alternatives)
- How will I use the data? (Trend tracking and benchmarking favor standardized 1 to 5 rating scales)
- What’s my survey length? (Longer surveys benefit from the speed of a 1 to 5 rating scale)
- Do I need fine-grained differentiation? (Most contexts don’t—the 1 to 5 rating scale suffices)
In 80% of cases, a well-designed 1 to 5 rating scale will be your best choice.
Illustration showing how customer feedback data flows from rating scales, survey responses, and binary yes-no inputs into a central analytics funnel, transforming feedback into insights such as trends, alerts, and performance charts for customer experience analysis and decision-making.

The Bottom Line
The 1 to 5 rating scale has achieved dominance not through accident but through proven effectiveness. It balances granularity with simplicity, provides statistically robust data while maintaining high response rates, and offers universal recognition across cultures and contexts.
While alternatives have their place—binary scales for quick checks, 10-point scales for NPS, semantic differentials for brand positioning—the traditional 1 to 5 rating scale remains the workhorse of feedback collection.
Your success depends not just on choosing the right scale but on implementing it professionally. From survey design through data analysis and action planning, modern feedback platforms streamline the entire process. By leveraging purpose-built tools, you ensure your 1 to 5 rating scale surveys deliver maximum value with minimum friction.
Ready to implement research-backed 1 to 5 rating scales that drive better business decisions? The right feedback platform transforms simple ratings into strategic intelligence that propels your organization forward.